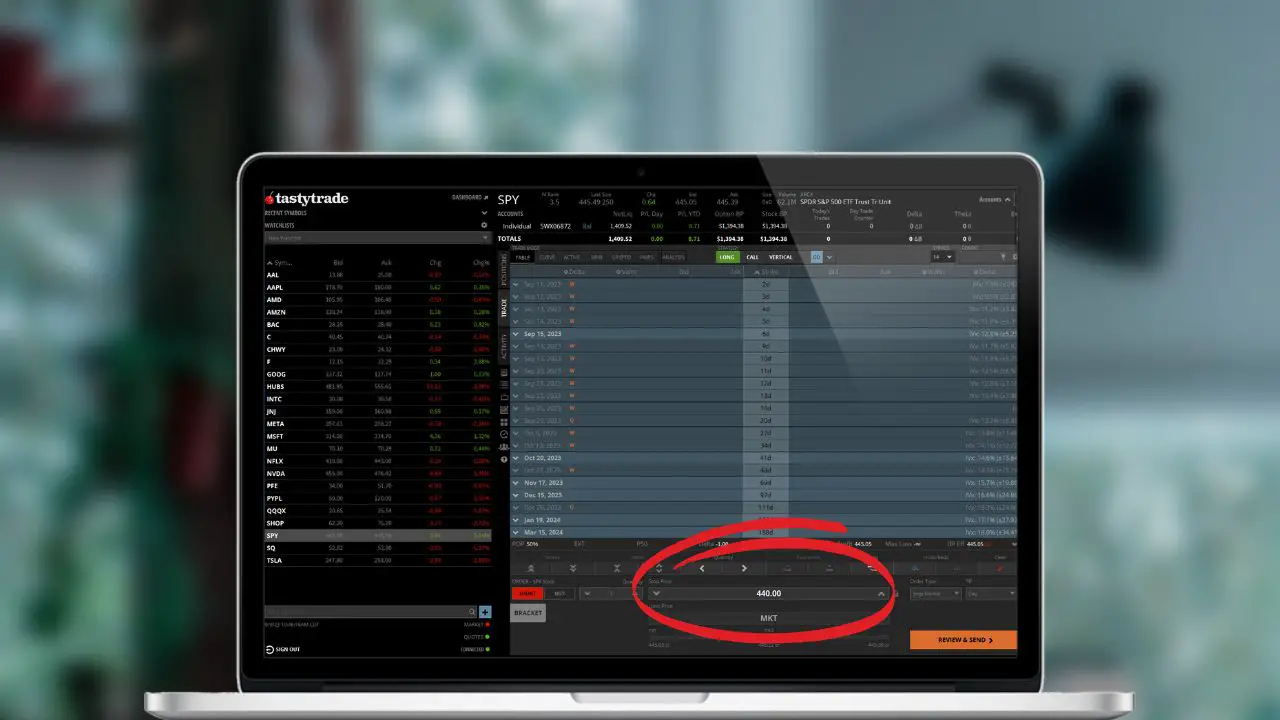
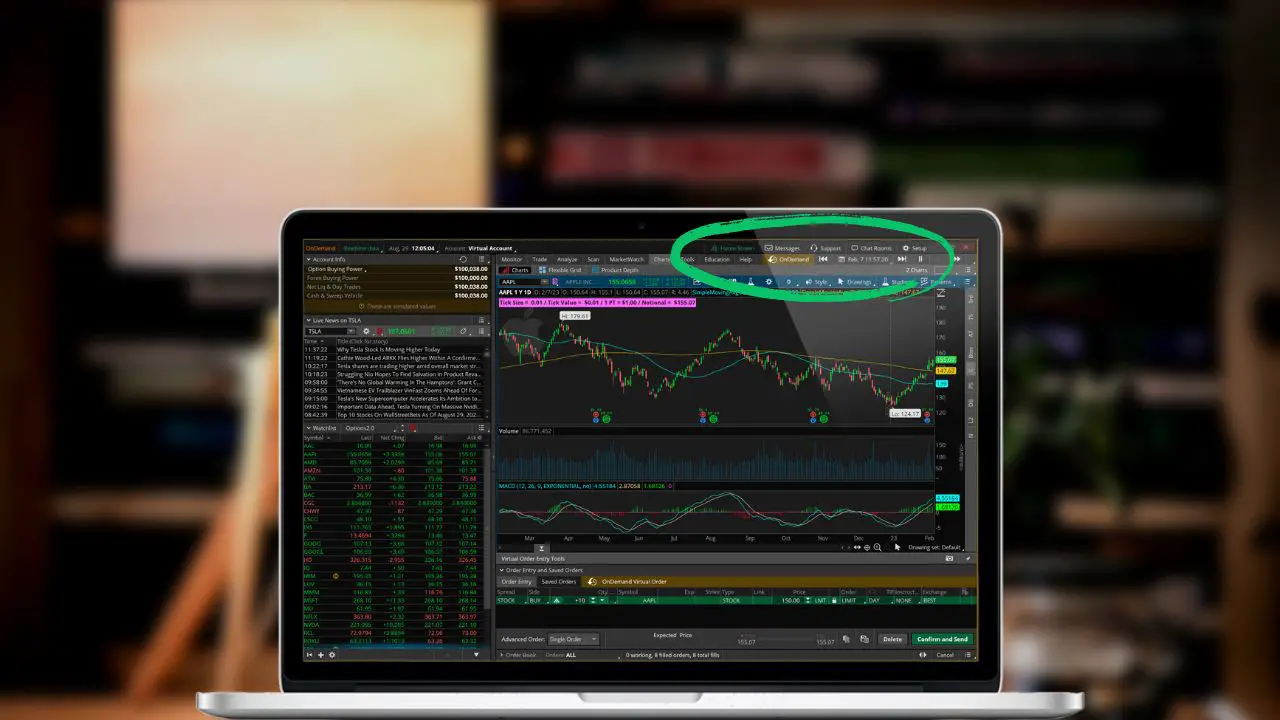
Thinkscript is an amazing tool within thinkorswim that allows us to create custom studies, tools, or information columns. In most cases, if the information is in thinkorswim, we’ll be able to use it and tailor it in a way that helps us make better trades.
The three scripts we’ll be going through today are all used to display option data that isn’t normally available within thinkorswim. Feel free to look through them and how they work and decide for yourself if you’d like them added to your own platform.
If you do, you can either copy the link and open it as a shared item or copy the entire script itself and create a new column manually.
Open Interest vs Volume Script
The open interest vs volume (OI / VOL) option script will display the difference in volume and open interest on each individual strike today. This can be used to quickly identify unusual option activity and those strikes which have significantly higher volume than is expected.
The column will remain blank unless the volume is at least two times greater than the open interest. If it is, the column will display as an orange background with a percentage value displaying how much greater the volume is than open interest.
Open Interest vs Volume: http://tos.mx/kZqzjej
def x2 = (volume > open_interest*2);
def x = (volume / open_interest)*100;
AddLabel(yes,  + Round(x , 0) + "%",color.black);
assignBackgroundColor (if x2 then color.orange  else color.black);
Premium Percent of Underlying Script
The option premium percent of underlying script (%UNDERLYING) will display the option premium as a percentage of the underlying stock. Using the example below, the total premium paid would be 2%.
AAPL 139 STRIKE PUT TRADING AT $3
%UNDERLYING = TOTAL PREMIUM ($300) DIVIDED BY TOTAL EXERCISE ($13,900)
I’ve found this script especially useful as someone that sells option premium quite a bit. This allows me the ability to quickly see the credit being received in relation to the risk being taken. It’s nearly identical to return on risk (ROR), but can also be used for call options.
Premium Percent of Underlying: http://tos.mx/6c3ceCk
def condition = ((close/close(getUnderlyingSymbol())));
#plot condition = if signal <= 0.04 then 1 else 0;

#def condition =(close - close[1])/close[1];
AddLabel(condition,Round(condition*100,0)+"%",if condition >= 0.5 then color.green else if condition <= -0.5 then color.red else color.white);
Option Percent Change Script
The option percent change script will display how much the option contract has changed in value over a set time period. The script below is currently set to display the percentage change over the past three trading days, but can be adjusted to any time period.
To adjust you simply need to open the script and replace the closing values (currently 3) to whatever value you should need. Although incredibly simple, this script will allow us to view those options which have had the most significant increase or decrease during a volatile move on the underlying stock.
Option Percent Change: http://tos.mx/PqPUFwW
def condition =(close - close[3])/close[3];
AddLabel(condition,Round(condition*100,0)+"%",if condition >= 0.5 then color.green else if condition <= -0.5 then color.red else color.white);


