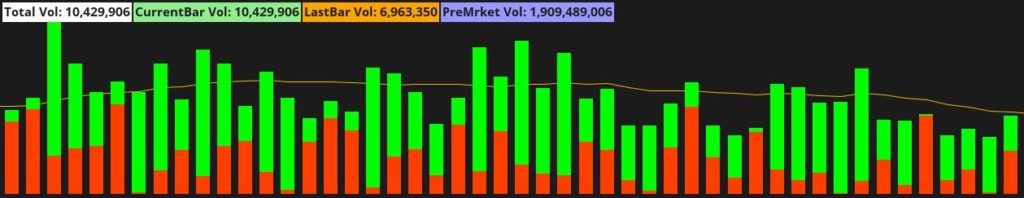
The default volume bars provided within ThinkorSwim are incredibly limited in the information they provide. Luckily for us, we do have the ability to load our own custom scripts and make a few much needed improvements.
The advanced volume bars below display far more information. That includes both buy and sell side volume for the time period, the average volume over the last 50 periods, and pre-market volume for the day.
Loading Studies Into Your Platform
There are several different methods to load this custom study into your own platform. You can either copy the shared item below and then open the item in your own platform.
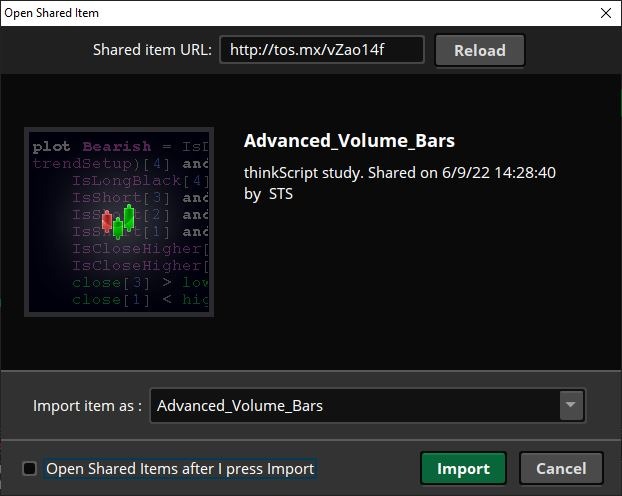
Once the shared item is imported you’ll find the study located within your studies menu. You will then have the ability to add and customize the study like any other within the platform.
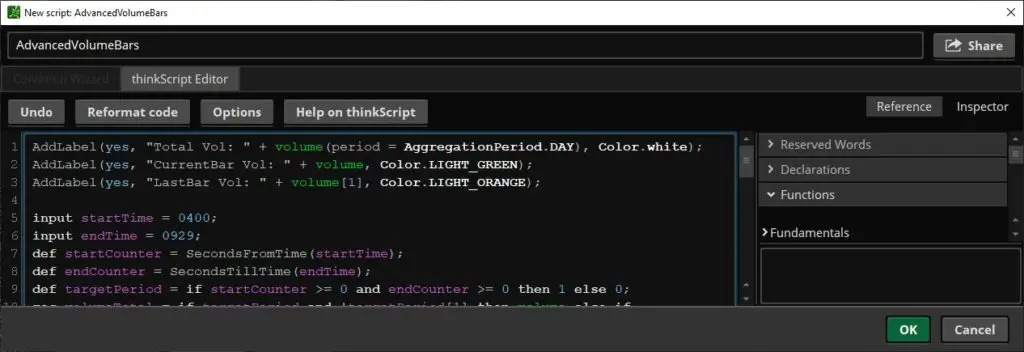
The other method is to actually copy the entire script below and create a new study through the “Edit Studies and Strategies” menu.
Advanced Volume Bars
thinkscript
AddLabel(yes, "Total Vol: " + volume(period = AggregationPeriod.DAY), Color.white);
AddLabel(yes, "CurrentBar Vol: " + volume, Color.LIGHT_GREEN);
AddLabel(yes, "LastBar Vol: " + volume[1], Color.LIGHT_ORANGE);

input startTime = 0400;
input endTime = 0929;
def startCounter = SecondsFromTime(startTime);
def endCounter = SecondsTillTime(endTime);
def targetPeriod = if startCounter >= 0 and endCounter >= 0 then 1 else 0;
rec volumeTotal = if targetPeriod and !targetPeriod[1] then volume else if targetPeriod then volumeTotal[1] + volume else volumeTotal[1];
AddLabel(yes, Concat("PreMrket Vol: ", volumeTotal), Color.VIOLET);

declare lower;
def O = open;
def H = high;
def C = close;
def L = low;
def V = volume;
def Buying = V * (C - L) / (H - L);
def Selling = V * (H - C) / (H - L);

plot SV = Selling;
SV.SetPaintingStrategy(PaintingStrategy.HISTOGRAM);
SV.SetDefaultColor(Color.LIGHT_RED);
SV.HideTitle();
SV.HideBubble();
SV.SetLineWeight(5);

plot BV =  volume;
BV.SetPaintingStrategy(PaintingStrategy.HISTOGRAM);
BV.SetDefaultColor(Color.GREEN);
BV.HideTitle();
BV.HideBubble();
BV.SetLineWeight(5);
input length = 20;
plot Vol = volume;
plot VolAvg = Average(volume, length);
Vol.SetPaintingStrategy(PaintingStrategy.HISTOGRAM);